04/07/2021

The phase diagram is the visual representation of the temperature and pressure dependence of a pure substance in a closed system. Explain the changes in the states of aggregation of matter as a function of the pressure and temperature to which the substance is subjected.

Previously, it is advisable to understand what we mean by changes in the aggregation state. They are specifically changes of state or phase. When a substance is simple, such as molecular fluids, it has well-defined melting and boiling points. Whereas, when the molar masses increase, these temperatures become ranges or rather, intervals, between which the phase change occurs.
Even in many cases, certain phase change temperatures are not reached, since the substances are previously decomposed. We define the following phase changes that will be located in the diagrams:
- Evaporation: from liquid to gas.
- Condensation: from gas to liquid.
- Sublimation: from solid to gas.
In general, they are thermal processes, they require the absorption or the delivery of Energy so that they occur, so that, as energy is added or removed, we will move along the diagram phase to see what state of aggregation the substance will be in.
As we well know, each substance is unique, so each substance will have its own unique phase diagram. Therefore, in each diagram a triple point will be presented, where the pressure and the temperature to which the three phases (solid, liquid and gas) coexist in Balance. Likewise, a point is presented criticalAt the upper end of the vapor or gas curve, this point indicates that at higher temperatures it cannot be brought to a liquid state beyond continuing to increase the pressure of the gas.
In general, phase diagrams are represented as follows:
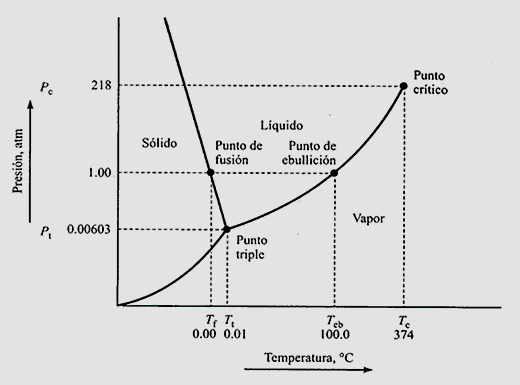
Here it is observed, a scheme where the pressure is located on the ordinate axis and the temperature on the abscissa axis. In general, the areas can also be colored for better visualization. To the left of graphic matter is in the solid state and, as the temperature increases (that is, the increases the energy delivered to the system) a phase change is observed to liquid and then, from liquid to steam. As long as, we move above the triple point. Below the triple point, the phase change is direct from solid to vapor or vice versa depending on the delivery or removal of energy.
Each of the curves represented are the equilibrium curves. For example, the curve from the triple point to the critical point is the liquid equilibrium curve - vapor, while the curve to the left is the liquid-solid equilibrium curve. Below is the solid-vapor equilibrium, since at low temperatures and pressures the vapor pressure of the solid is represented. Each of these equilibrium curves represent the phase changes that were named above.
The phase diagram represented is specifically the phase diagram of water, noting that, at a pressure of 1 atm, the boiling point is 100ºC (normal boiling point) and the melting temperature is 0ºC (melting point normal). The critical point is observed with a critical temperature of 374ºC and a critical pressure of 218 atm while the triple point, where the three equilibria coexist, is 0.00603 atm and 0.01ºC.
Furthermore, we can observe that, if we increase the pressure, the melting point decreases while the boiling temperature increases, this is so due to the slopes of each of the curves of Balance.
As we mentioned previously, each substance has its own phase diagram, therefore, the trend mentioned may not be replicated in all case studies since the slopes of the curves of balance vary.
Topics in Phase Diagram