
04/07/2021


Z scores result from a transformation of the data based on the standard deviation, with the purpose of making comparisons between variables.
To deepen the concept and elements of Z scores, it is necessary to review some related previous concepts that will facilitate their comprehension.
Center. It refers to the value of the variable or variables that are most likely to be found in our data. The most common value of the center is the mean or average, which is obtained by adding all the data and dividing them by the amount of data they have.
Dispersion. It refers to the degree of distance or concentration of the values with respect to the center of the variables. The most common dispersion data are 1) Standard deviation or standard deviation, which tells us how far the data is from the mean. This is calculated by subtracting the mean value from each data and raising it to the square, then the mean of these values is calculated and finally the square root of this new mean is evaluated; 2)
Variance, this turns out to be the standard deviation but raised to the square, it is obtained following the same procedure for the standard deviation, but without calculating the square root.The shape of the distribution. Reflects how often a value or range of values is repeated. It is necessary to differentiate between theoretical distributions, which formulate math, while empirical distributions are formed by the values that a variable takes in a sample.
by way of synthesis, we could say that the center is a representative of the data, the dispersion helps to specify if the center is a good or bad representation of the data and the shape of the distribution helps to detect where the data are grouped values.
One of the most common tasks performed in the investigation is the comparison of two or more different variables, however, on many occasions the researchers face the problem that their data cannot be comparable because the variables present a center or a very different distribution or worse still, they have different metrics, that is, they were measured in a different way (for example, the scales Wechsler, to measure the intelligence quotient, have a series of tests that qualify from the execution time, the correct answers or the absence or presence of answer). for such reason It remains to be wondered how to solve this problem?
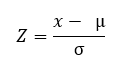
The answer is clear, a transformation of the data must be performed in Z scores or typical scores so that both are in the same metric or have the same spread. Said transformation is carried out using the following formula, where x is the value a transform, µ is the mean of the original distribution and σ is the standard deviation of the original distribution.
The result obtained is scores expressed in units of standard deviation and that meet the necessary requirements for data comparison.
Scores with the same center. Regardless of the mean of the original distribution, when you transform into Z scores the mean of all variables becomes zero. In this sense, positive Z scores correspond to scores higher than the original mean, while negative scores correspond to scores lower than the mean.
Scores with the same spread. Just as the mean of the Z scores becomes zero, the spread of all variables becomes one.
Scores with the same metric. The metric for the new scores is expressed in units of the standard deviation.
Although Z scores do not have a minimum or maximum limit, they tend to take values between -3 and 3; those values that exceed these values represent atypical cases, which would need another type of treatment.
Z scores are not the only method transformation, an alternative option is the percentiles, which refer to the relative position of a score taking into account the percentage of accumulated cases. This transformation performs the same process previously described, obtaining the same center (50), the same dispersion (0-100) and the same metric (percentage units).
The main difference between both transformations resides in the alteration of the shape of the distribution, since in the transformation into percentiles this is altered, while in the Z scores it is maintained equal. This means that, if the data distribution is skewed, when transformed into percentiles it becomes symmetrical, but if it is transformed into Z scores it will remain asymmetrical.