Gantt Chart Example
Administration / / July 04, 2021
The Gantt diagram is a tool widely used in administration to expose graphically, using a horizontal bar chart, the deadlines in which a series of activities and processes are expected to be carried out. It was devised by the engineer Henry Laurence Gantt, around 1910. The purpose of the Gantt chart is to graphically explain the relationship of time and development of related processes, as well as to show the development of the different phases of a procedure.
The Gantt chart is a complementary graphical tool to other tools, mainly schedules, which are work lists in which processes and procedures are organized, and the times in which they are expected develop.
In general, these tools cover specific data, and be supplemented with other diagrams for each activity.
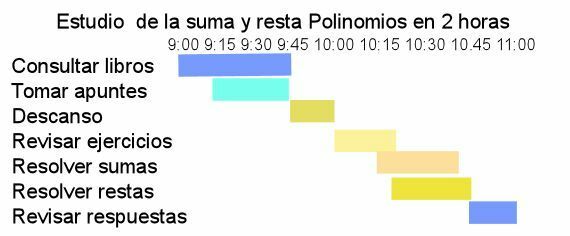
Thus, for example, if we talk about an activity, such as learning polynomials, we can think that we can do it in a time of two hours. This activity can be divided into small processes that will take us a certain time. Thus, we will review the texts from 9:00 a.m. to 9:45 a.m. We will take the notes between 9:15 and 9:45 (simultaneous tasks). We will rest for 15 minutes, and then we will begin to review the exercises. At 10:15 we begin to solve the additions, thinking that it will take a half hour with the additions, and more or less the same with the subtractions. At 10:45 we started reviewing the responses. We can see this in the following Gantt chart:
The Gantt chart is a tool in which we can expose a series of activities, without However, due to their graphical support feature, the activities should be briefly presented and concise. For each activity a diagram can be made in which the times of each procedure are put, and, if necessary, a diagram of the tasks of each procedure. This is useful, since each group in charge of a procedure can have and consult as many times as it does not need, its own Gantt chart.
Recommendations to make a good Gantt chart:
- Let's try to order the tasks in the sequence of time that best fits, grouping together some common tasks that are developed simultaneously.
- The diagram should deal with the activities that correspond to the same group or work team.
- Each diagram should briefly state the activities.
- If the diagram consists of several complex activities, it is recommended to make a diagram for each of the processes or tasks of each activity.
Examples of Gantt chart study project:

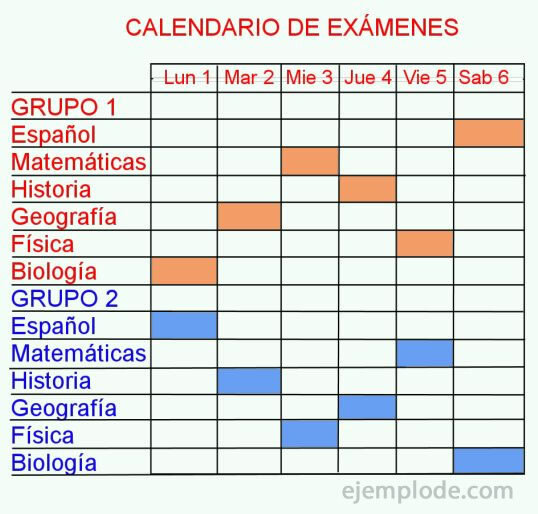
Example of a calendar type Gantt chart:

Some programs that can be used to create Gantt charts are:
- Gantt Project
- Tom's planner
- Smart Sheet
- Microsoft Project

